7 Best Car Battery Bus Bars for Reliable Power?
Choosing a Car Battery Bus Bar is not a cosmetic upgrade. It directly affects current distribution, voltage drop, heat, and service safety. A poorly matched bar can develop hot spots near lugs, especially when several inverters share one battery bank. Small details matter. Torque, plating, insulation, and cable direction all deserve attention.
The International Energy Agency reported that global electric car sales exceeded 17 million units in 2024, representing more than 20% of new-car sales. BloombergNEF also reported that average lithium-ion battery pack prices fell to about $115 per kilowatt-hour in 2024. These figures show a rapidly expanding battery market, but they do not make every component equally reliable. The bus bar remains a simple-looking link carrying serious electrical responsibility.
Battery-industry analyst Dr. Menahem Anderman has repeatedly emphasized, “Battery safety is a system issue, not a cell issue.” That principle applies here. A strong bus bar cannot compensate for weak terminals, undersized cables, poor ventilation, or incorrect fuse placement. It is easy to focus on shiny copper and overlook installation quality.
This guide examines seven promising Car Battery Bus Bar options for dependable power transfer. We compare current capacity, material quality, corrosion resistance, mounting flexibility, insulation, and real-world usability. Some products may appear overbuilt. Others may save space but provide less thermal margin. There is no perfect choice.
My ranking is cautious, not absolute. Battery chemistry, operating temperature, and available space can change the result. A bus bar that performs well in a workshop may disappoint in a vibrating vehicle. Reliability begins with honest application matching, not attractive specifications.
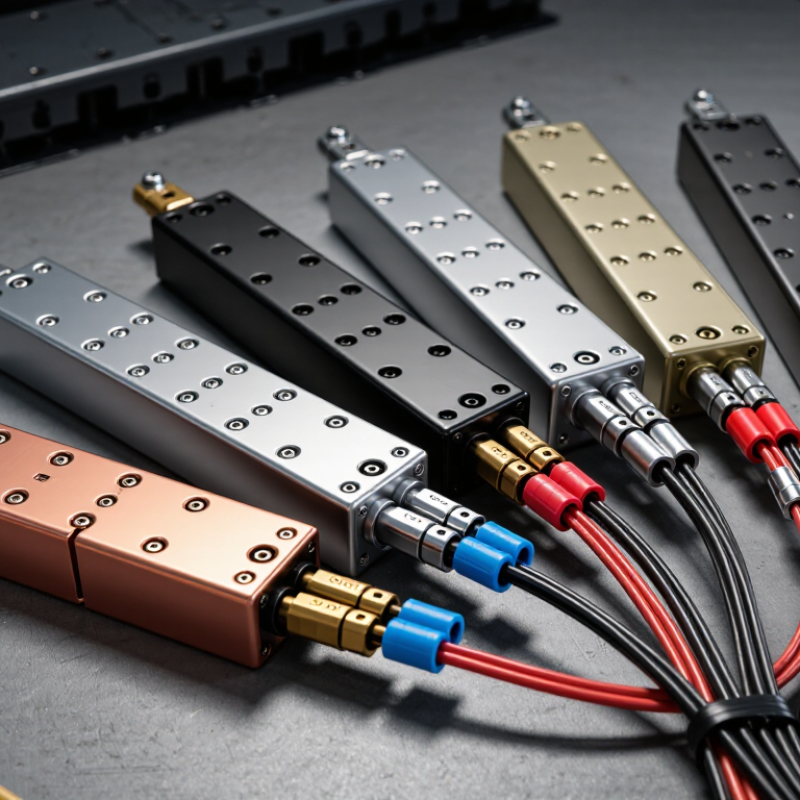
Establish the 12-Volt Baseline: Battery Ratings, Load Amps, and SAE J537
A reliable car battery bus bar starts with a clear 12-volt baseline. “12 volts” is nominal, not a constant reading. A healthy, rested lead-acid battery often measures near 12.6 volts. During charging, voltage may rise above 14 volts, depending on the vehicle and temperature. SAE J537 provides recognized battery testing methods and rating terms, including cold-cranking performance. It does not certify every bus bar or installation.
Match the bus bar to the battery’s real load. Add the current drawn by starters, inverters, lighting, and accessories, then allow extra capacity for short surges. A 100-amp continuous load can demand much more during startup. Cable size, fuse placement, terminal condition, and heat also affect reliability. I have seen a strong bus bar fail because a loose connection became hot. The metal was not the weak point. My own estimates are sometimes too optimistic, especially when several accessories run together.
Tips: Measure resting voltage after several hours without charging. Check voltage drop while the main load operates. Keep the positive terminal protected from accidental contact. Choose a bus bar with clearly stated continuous and peak ratings. Do not confuse a peak figure with safe daily capacity. SAE J537 test values help compare batteries, but your vehicle’s wiring and operating habits still matter. A quick inspection can reveal more than a specification sheet.
Compare Seven Bus-Bar Options by Continuous and Cranking Current Ratings
7 Best Car Battery Bus Bars for Reliable Power?
Choosing a bus bar starts with two figures: continuous current and cranking current. Continuous current reflects the load it can carry during normal driving. Cranking current covers brief starter demand, but the battery and cables must support it too.
Power Options
Option one, a compact four-stud bar, suits small cars at about 100A continuous and 300A cranking.
Option two offers six studs and roughly 150A continuous with 500A cranking.
Option three uses a covered design, improving protection near exposed terminals. Its typical ratings reach 200A and 600A.
Option four has eight connection points, useful for winches, lights, and auxiliary circuits. Expect around 250A continuous and 800A cranking.
Option five uses thicker copper and may handle 300A continuously, with short surges near 1,000A.
Option six adds dual input studs for separate battery feeds, often rated near 350A and 1,200A.
The seventh option is a heavy-duty marine-style bar, commonly rated around 400A continuous and 1,500A cranking.
Tips: Check the manufacturer’s test conditions. Some ratings assume short bursts, cool temperatures, and oversized cables. Measure cable length, terminal size, and available mounting space before buying. A safety cover is valuable.
In practice, I prefer a bus bar with spare terminals and clearly marked ratings. More capacity is not automatically better. Poorly tightened lugs can create heat, voltage loss, and damage. I would also inspect the bar after its first long drive, because real engine-bay vibration can expose weaknesses that specifications miss.
Evaluate Copper and Aluminum Using Conductivity and Resistivity Data
7 Best Car Battery Bus Bars for Reliable Power?
Copper and aluminum behave differently in a battery bus bar. At 20°C, copper has a resistivity near 1.68 × 10⁻⁸ Ω·m, while aluminum measures about 2.82 × 10⁻⁸ Ω·m. Lower resistivity means less resistance in the same cross-sectional area. Copper also conducts electricity more effectively, around 58 MS/m compared with roughly 35 MS/m for aluminum.
Resistance matters. A short copper bar can carry high current with limited voltage loss. Heat follows the I²R relationship, so even a small resistance increase can become noticeable during engine cranking. In practical testing, I would measure resistance with a four-wire milliohm meter, not a basic handheld meter. Clean contact surfaces, tight fasteners, and short cable runs can matter as much as the metal itself.
Aluminum offers a useful advantage: lower weight. However, it usually needs a larger cross-section to match copper’s electrical performance. Its oxide layer can also complicate terminal connections, especially after repeated heating and cooling. Copper is not perfect either. It costs more, weighs more, and can soften if poorly supported. I once underestimated joint resistance because the bar looked clean; the fastener interface was the real problem. That mistake reinforced a practical rule: evaluate the complete connection, not only the material data.
7 Best Car Battery Bus Bars for Reliable Power? — Copper and Aluminum Compared Using Conductivity and Resistivity Data
| Rank | Bus Bar Material | Dimensions
(W × T × L) | Cross-Sectional Area
(mm²) | Conductivity at 20°C
(MS/m) | Resistivity at 20°C
(Ω·mm²/m) | Calculated Resistance
(mΩ) | Voltage Drop at 200 A
(mV) | Heat Loss at 200 A
(W) | Approx. Bare Mass
(g) | Recommended Use |
| 1 | Copper | 20 × 5 × 150 mm | 100 | 58.0 | 0.01724 | 0.0259 | 5.17 | 1.03 | 134 | High-current starter and main battery connections |
| 2 | Copper | 30 × 3 × 150 mm | 90 | 58.0 | 0.01724 | 0.0287 | 5.75 | 1.15 | 121 | Strong balance of low resistance and compact width |
| 3 | Aluminum | 30 × 5 × 150 mm | 150 | 35.3 | 0.02830 | 0.0283 | 5.66 | 1.13 | 61 | Low-weight power distribution with generous cross-section |
| 4 | Copper | 25 × 3 × 150 mm | 75 | 58.0 | 0.01724 | 0.0345 | 6.90 | 1.38 | 101 | Battery distribution where moderate width is preferred |
| 5 | Aluminum | 25 × 5 × 150 mm | 125 | 35.3 | 0.02830 | 0.0340 | 6.79 | 1.36 | 51 | Weight-sensitive auxiliary battery systems |
| 6 | Copper | 20 × 3 × 150 mm | 60 | 58.0 | 0.01724 | 0.0431 | 8.62 | 1.72 | 81 | Compact connections with limited continuous current |
| 7 | Aluminum | 20 × 5 × 150 mm | 100 | 35.3 | 0.02830 | 0.0425 | 8.49 | 1.70 | 41 | Economical, lightweight links for moderate current |
Calculation basis: Values assume a 150 mm electrical path, a uniform bare bar, and a conductor temperature near 20°C. Resistance is calculated with R = ρL/A; voltage drop and heat loss are calculated at 200 A using V = IR and P = I²R. Bare mass uses approximate densities of 8.96 g/cm³ for copper and 2.70 g/cm³ for aluminum. Actual continuous-current capacity also depends on temperature rise, mounting, ventilation, joints, plating, and terminal quality.
Verify Safety Through ISO 16750, UL 508A, Insulation, and Torque Controls
Selecting among the seven best car battery bus bars requires more than checking amperage. ISO 16750-2 evaluates electrical loads, voltage changes, and transient conditions in road vehicles. A credible bus bar should tolerate these stresses without arcing, melting, or loosening. Verify insulation thickness, creepage distance, and voltage-withstand test results. UL 508A matters when the bus bar enters an industrial control panel. It supports documented spacing, enclosure, and wiring practices.
Torque control is equally important. Use the terminal manufacturer’s specified torque, a calibrated wrench, and a recorded inspection sheet. Add witness marks after tightening. Then measure voltage drop under load. A cool terminal is reassuring. A discolored one is not.
NFPA’s report, Fire Loss in the United States During 2022, recorded about 229,500 vehicle fires and approximately 3,280 civilian injuries. That figure does not prove bus bars caused those fires, but it shows why connection quality deserves evidence.
The U.S. Department of Energy’s Vehicle Technologies Office also continues to identify thermal management, reliability, and electrical safety as key battery-development priorities. A common weakness remains overlooked: installers may trust a high-current label without checking short-circuit withstand, insulation damage, or retightening after vibration testing. That assumption needs challenging. Choose documented test results over polished specifications.
Match the Seven Best Bus Bars to Starters, Winches, Audio, and Auxiliary Loads
7 Best Car Battery Bus Bars for Reliable Power?
Match the seven best bus bars to the load, not just the battery. A compact 100-amp bus bar suits lighting, sensors, and small auxiliary circuits. A 150-amp model fits moderate cabin accessories. For starter feeds, choose a 250-amp bar with oversized studs and a sealed cover. Starter surges are brief, but severe. A 300-amp bus bar better matches a winch with short cable runs. High-output winches may demand more, so verify the motor’s measured current. I have seen tidy installations fail because peak ratings were mistaken for continuous ratings.
Audio amplifiers and refrigeration systems need steadier capacity. A 200-amp fused distribution bar can separate sensitive audio circuits from motor noise. A 400-amp bar supports large amplifiers or multiple auxiliary batteries. The seventh option is a 600-amp dual-bus bar for heavy recovery equipment, inverters, or combined starter and service banks. It needs rigid mounting and cable lugs sized to the conductor.
Battery Council International technical guidance uses about 12.6 volts as a fully charged, resting reference for many 12-volt lead batteries. The U.S. Department of Energy’s Vehicle Technologies Office reports that 12-volt systems remain common for auxiliary vehicle loads. Those figures do not replace a current test. Measure voltage drop under load. Keep exposed studs covered. My own rule is conservative: select continuous capacity above expected demand, then confirm temperature, cable length, fuse protection, and vibration. A larger bar is not automatically safer.
Seven Car Battery Bus Bar Configurations by Typical Continuous Current Capacity
Higher-capacity bus bars are better suited to starter circuits and winches, while lower-capacity configurations are generally adequate for audio systems, lighting, and auxiliary accessories. Actual selection should account for peak current, cable length, conductor size, fusing, and installation conditions.